Air Pollutant Concentrations (μg/m3)
Period: January 2023 - December 2023
General Stations
| Station | NO2 | PM10 | PM2.5 |
|---|
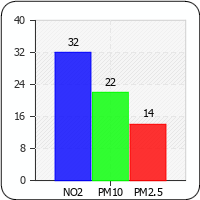
| Central/Western | 32 | 22 | 14 |
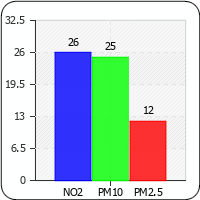
| Southern | 26 | 25 | 12 |
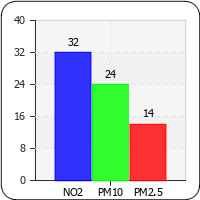
| Eastern | 32 | 24 | 14 |
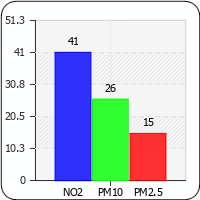
| Kwun Tong | 41 | 26 | 15 |
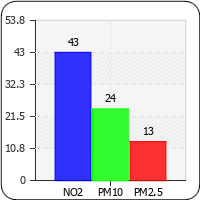
| Sham Shui Po | 43 | 24 | 13 |
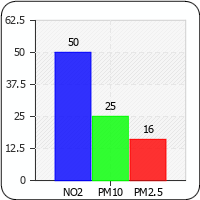
| Kwai Chung | 50 | 25 | 16 |
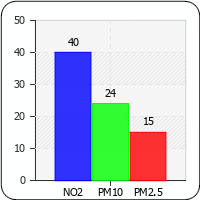
| Tsuen Wan | 40 | 24 | 15 |
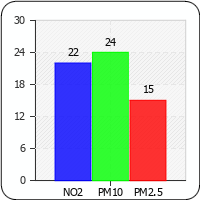
| Tseung Kwan O | 22 | 24 | 15 |
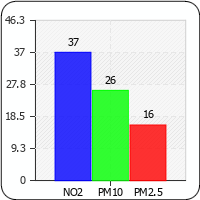
| Yuen Long | 37 | 26 | 16 |
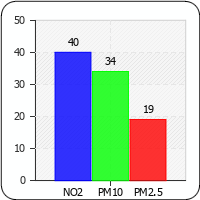
| Tuen Mun | 40 | 34 | 19 |
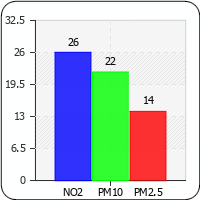
| Tung Chung | 26 | 22 | 14 |
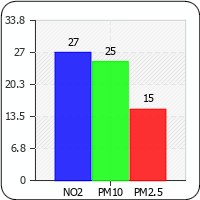
| Tai Po | 27 | 25 | 15 |
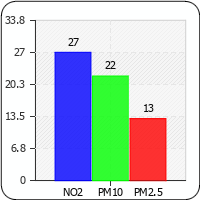
| Sha Tin | 27 | 22 | 13 |
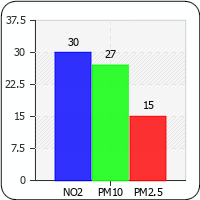
| North | 30 | 27 | 15 |
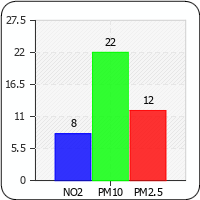
| Tap Mun | 8 | 22 | 12 |
Pollutant concentrations in micrograms per cubic metre (μg/m
3)
Roadside Stations
| Station | NO2 | PM10 | PM2.5 |
|---|
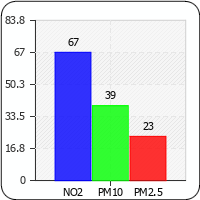
| Causeway Bay | 67 | 39 | 23 |
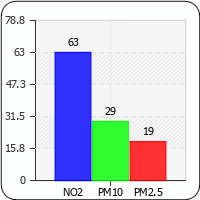
| Central | 63 | 29 | 19 |
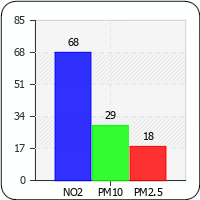
| Mong Kok | 68 | 29 | 18 |
Pollutant concentrations in micrograms per cubic metre (μg/m
3)
Annual AQI Values
Period: January 2023 - December 2023
General Station
| Station | NO2 | PM10 | PM2.5 |
|---|
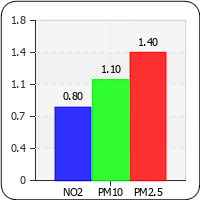
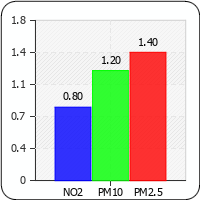
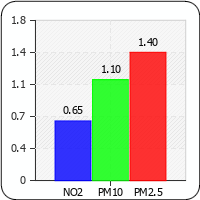
| Central/Western | 0.80 | 1.10 | 1.40 |
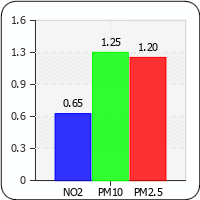
| Southern | 0.65 | 1.25 | 1.20 |
| Eastern | 0.80 | 1.20 | 1.40 |
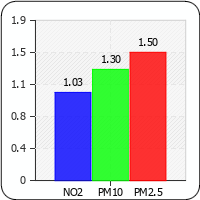
| Kwun Tong | 1.03 | 1.30 | 1.50 |
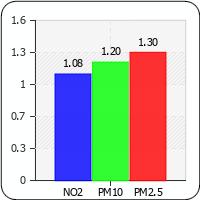
| Sham Shui Po | 1.08 | 1.20 | 1.30 |
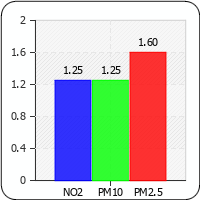
| Kwai Chung | 1.25 | 1.25 | 1.60 |
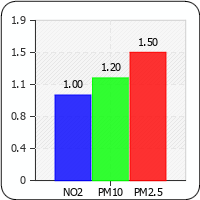
| Tsuen Wan | 1.00 | 1.20 | 1.50 |
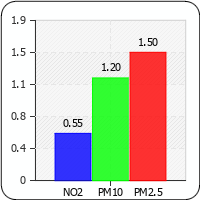
| Tseung Kwan O | 0.55 | 1.20 | 1.50 |
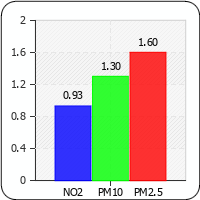
| Yuen Long | 0.93 | 1.30 | 1.60 |
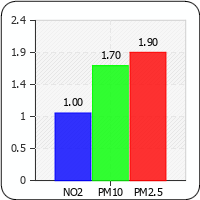
| Tuen Mun | 1.00 | 1.70 | 1.90 |
| Tung Chung | 0.65 | 1.10 | 1.40 |
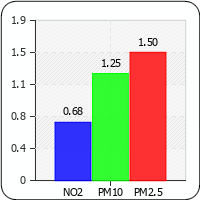
| Tai Po | 0.68 | 1.25 | 1.50 |
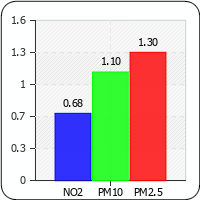
| Sha Tin | 0.68 | 1.10 | 1.30 |
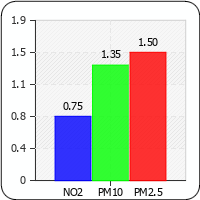
| North | 0.75 | 1.35 | 1.50 |
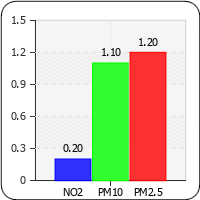
| Tap Mun | 0.20 | 1.10 | 1.20 |
AAQI = 12-month rolling concentrations/Annual WHO AQG concentration
Roadside
| Station | NO2 | PM10 | PM2.5 |
|---|
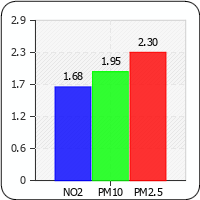
| Causeway Bay | 1.68 | 1.95 | 2.30 |
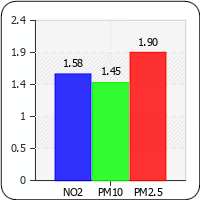
| Central | 1.58 | 1.45 | 1.90 |
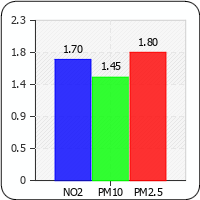
| Mong Kok | 1.70 | 1.45 | 1.80 |
AAQI = 12-month rolling concentrations/Annual WHO AQG concentration


