(At 2024-04-30 10:00)
General Stations
Central/Western
Southern
Eastern
Kwun Tong
Sham Shui Po
Kwai Chung
Tsuen Wan
Tseung Kwan O
Yuen Long
Tuen Mun
Tung Chung
Tai Po
Sha Tin
North
Tap Mun
Roadside Stations
Causeway Bay

|
|
Added Health Risk
(FAQs) |
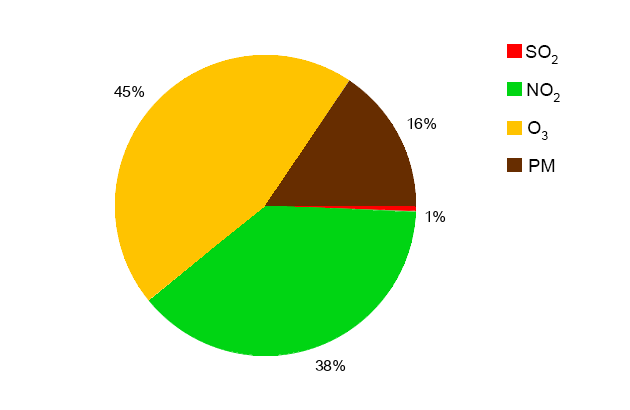
Contribution by each pollutant on the added health risk (percentage) | |||
|---|---|---|---|---|
| SO2 | NO2 | O3 | PM | |
| 3.29 | 0.070 (2%) | 1.617 (49%) | 0.969 (29%) | 0.631 (19%) |
Remarks:
(1) Time shown is in Hong Kong time.
(2) The total percentage may not be equal to 100% due to rounding.
(3) Abbreviation:
SO2 - sulphur dioxide, NO2 - nitrogen dioxide, O3 - ozone,
PM – respirable suspended particulates (PM10) or fine suspended particulates (PM2.5), whichever poses a higher health risk.
(4) The AQHI information is based on real time data taken directly from EPD's Air Quality Monitoring Network.


